Contents
Live bee hive scales
This program generates the graphs and explanatory text from the hive data for subsequent publication by publish_bee_hive.m.
Loaded data ...
The bee hive
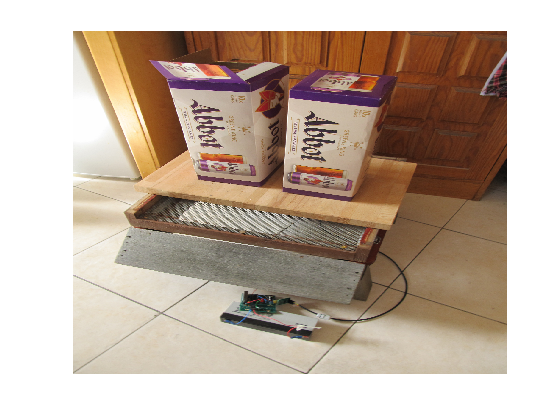
Minute by minute hive weight
The figure below shows the recorded hive weight on a minute by minute basis
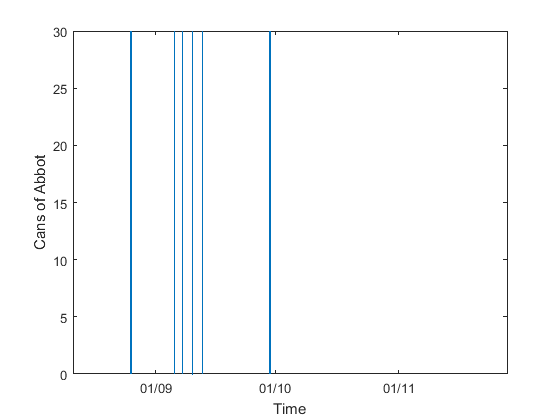
Hive temperature
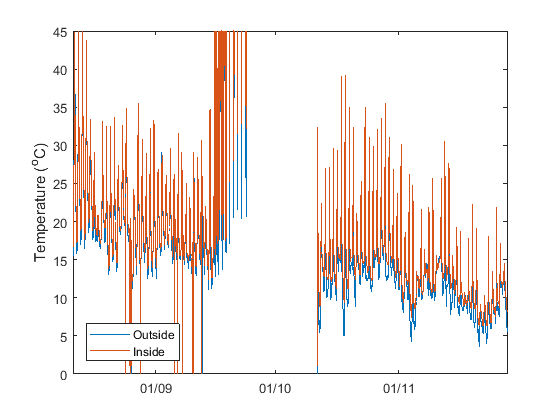
The figure below will eventually show the recorded temperature in the hive - it also shows the temperature outside. (Note internal data is not currently bee hive data. It is from an open greenhouse in UK).
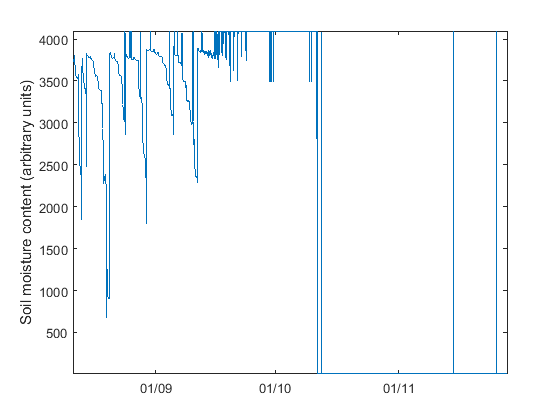
Soil moisture content
The next graph shows the output from a very simple soil moisture sensor in a chilli pot in the greenhouse. The idea is ultimately to develop an evaporo-transpiration model which will allow the need for watering to be predicted from weather data and watering history alone.
System battery voltage
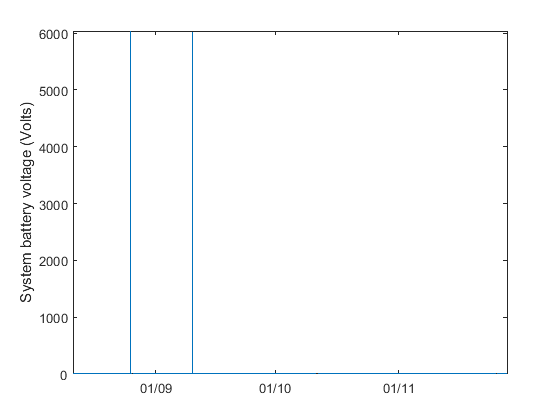
The electric hive is powered by a rechargeable battery, charged by a pair of solar cells (PV panels). The next graph shows the battery voltage. The system is indoors at the moment so the PV panels are not contributing anything useful.
Data last updated
These graphs include data up to: 28/11/22 07:00 (BST)