Contents
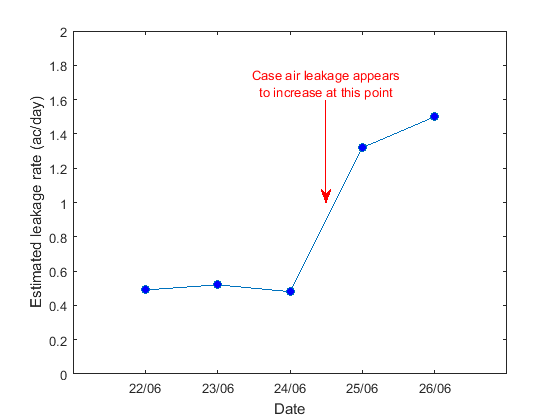
Estimated daily leakage rates inside display case CA01
The figure shows the best daily estimates of case leakage over the past five days.

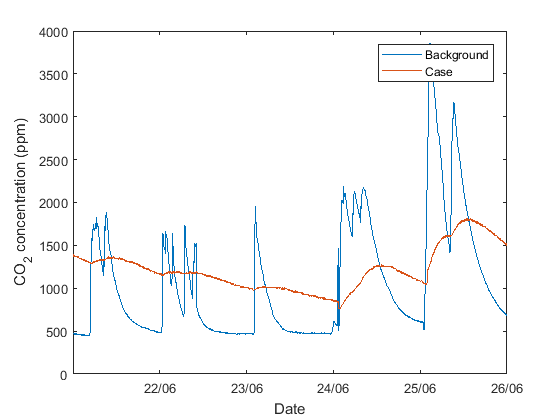
Raw measured data
The figure shows the  concentrations measured at one minute intervals over the past five days.

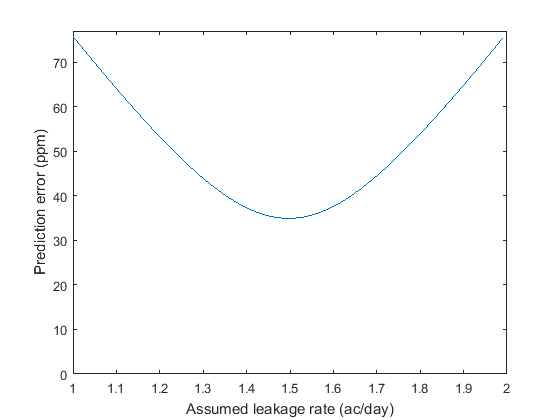
How the leakage rates are determined
These leakage rates have been estimated by comparing the CO<sub>2</sub> concentration predicted in the case over a range of leakage rates with that actually observed. The figure below shows how the error of that prediction varies with assumed leakage for the last days data. The fact that the error shows a clear minimum allows the leakage rate to be estimated with a relatively high level of certainty.
